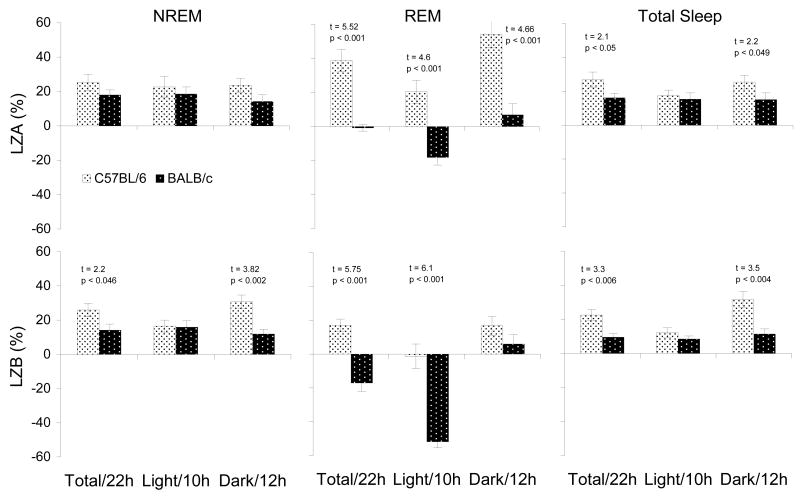
Figure 4.
NREM, REM and total sleep plotted as a percentage change relative to those of control (SAL) for LZA (0.5 mg/kg) and LZB (1.5 mg/kg) injections during total 22-h, 10-h light and 12-h dark periods in C57BL/6J and BALB/cJ mice. Values are means±SEM. t- and p-values for significant differences between strains are indicated above the appropriate bas.

