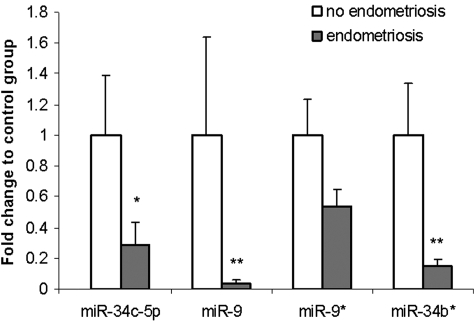
Figure 2.
Validation by qRT–PCR analysis of miRNA expression. Data are presented as fold change of expression in eutopic endometrium from women with endometriosis relative to expression in endometrium from women without endometriosis after normalization to miR-5S. For comparative analysis, the expression values for each miRNA were set as 1 in ESE from women without endometriosis. Significant fold changes are marked by *P = 0.05; **P < 0.05. Data are mean ± SEM.

