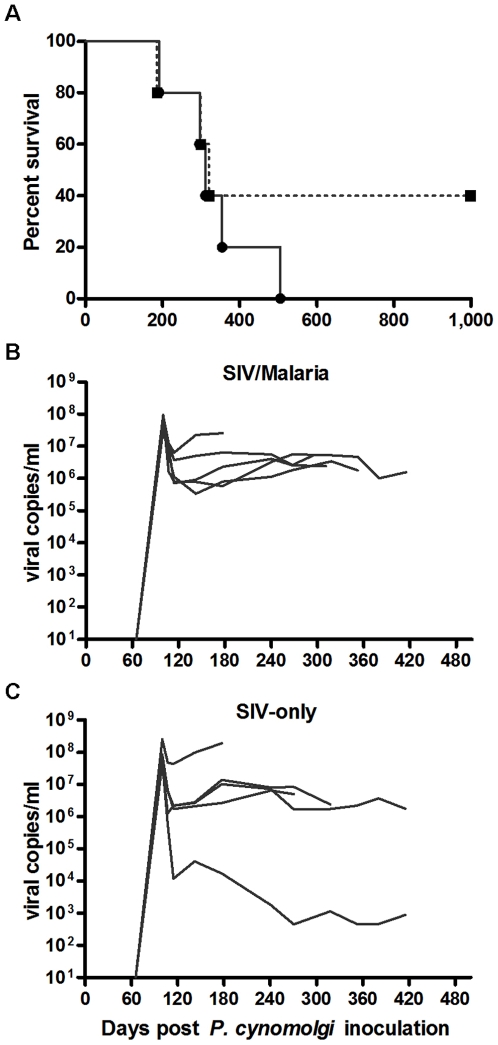
Figure 2. Decreased survival among co-infected animals was not associated with increased viral load.
(A) Kaplan-Meier curve showing survival in the co-infected group (solid line; 1657 group survival days) and SIV-only group (dashed line; 2657 group survival days). Individual rhesus plasma viral RNA levels are shown for (B) co-infected and (C) SIV-only groups. Averaged viral set points (day 114) were 2.57×10⁶ and 9.95×10⁶ RNA copies/ml plasma, respectively.

