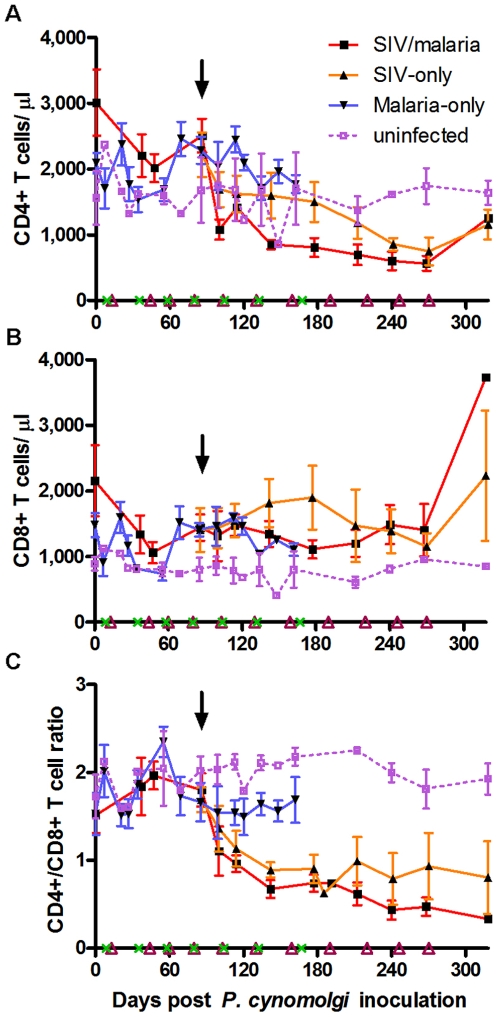
Figure 3. Impact of co-infection on CD4+ and CD8+ T cell dynamics and CD4+/CD8+ T cell ratios.
Four-color flow cytometry showing T cell dynamics for (A) CD4+ T cells (CD3+CD20−CD4+CD8−), (B) CD8+ T cells (CD3+CD20−CD4−CD8+), and (C) CD4+/CD8+ T cell ratios. In this and subsequent figures, results from animals were averaged through day 318. The downward arrow indicates time of SIV inoculation (day 86). Parasitemias are indicated on the x-axis by a green x (malaria-only) or an open purple triangle (SIV/malaria). SIV-only animals were sampled starting at SIV infection, and the malaria-only animals were sampled until the group stopped relapsing. Results for individual animals throughout the course of infection are shown in Figure S1.

