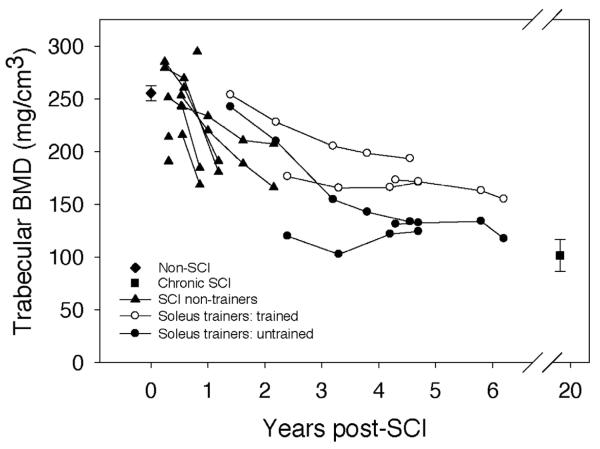
Figure 3.
BMD of the entire 4% tibia site cross-section: “bookend” values of the non-SCI and the chronic SCI cohorts are mean (SE) for all subjects, bilateral limbs. Data from all other subjects are presented longitudinally with each limb shown separately. (The two limbs for a subject on any given scan date share x-axis co-ordinates).

