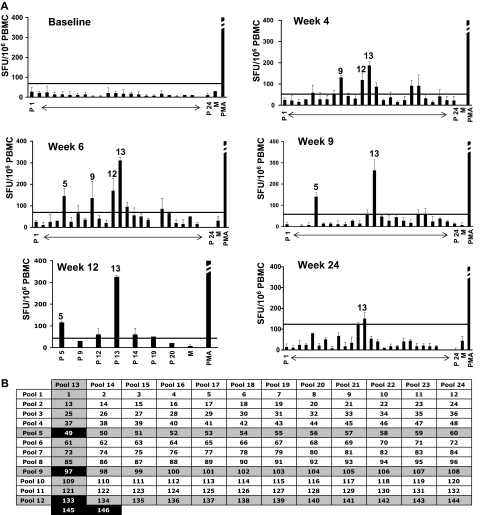
Figure 2.
Capsid-specific IFN-γ ELISpot on PBMCs from subject E. (A) Capsid-specific IFN-γ ELISpot; results are expressed in SFU/106 PBMCs (average ± SD). Error bars represent SD. P 1 to P 24, AAV peptide matrix pools. Positive pools are indicated (positive defined as at least 3-fold above the medium control and at least 50 SFU/106 PBMCs). Horizontal lines represent the cutoff for positivity. PMA indicates positive control (> 1000 SFU/106 PBMCs for all time points); M, medium only. (B) Matrix analysis of results. Peptides identified by positive pools at any time point are indicated in black boxes. Note that peptides 145 and 146 were included in the matrix pools 12 and 13.

