
Fig. 2.
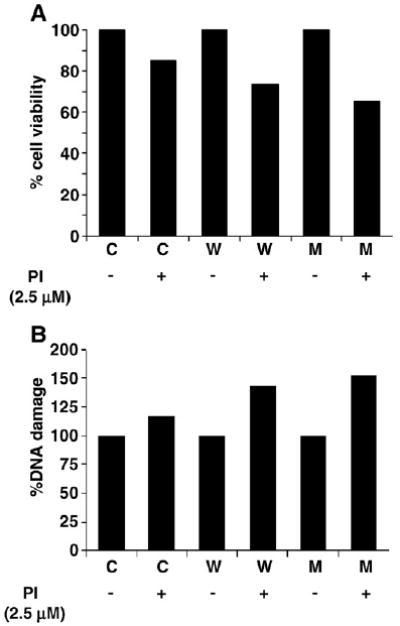
Generation of dynamic model of α-syn toxicity (A and B are in silico data). (A) Dose-dependent effect of PI (2.5 μM) in silico on cell viability (with 8-OHdG levels as marker of apoptosis) in cells expressing either WT (W) or A53T α-syn (M) compared to control (C). (B) Percentage DNA damage without and with PI (2.5 μM) in control, WT, and A53T α-syn cells measured by the amount of 8-OHdG, a biomarker for DNA damage and apoptosis.