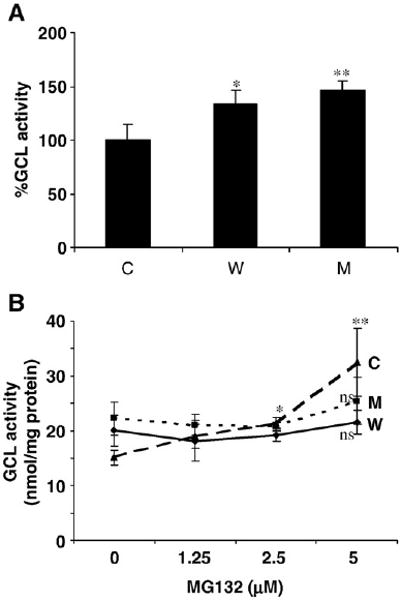
Fig. 5.

Effects of α-syn expression (±PI) on GCL activity in α-syn-expressing vs control cells (A and B are in vitro data). (A) GCL activity in the absence of proteasome inhibition. *p> 0.05 compared to control cells; **p< 0.05 compared to control cells. (B) GCL activity in the presence of MG132 addition. *p< 0.005 compared to untreated cells; **p< 0.05 compared to A53T cells; ns, not significant compared to untreated cells.
