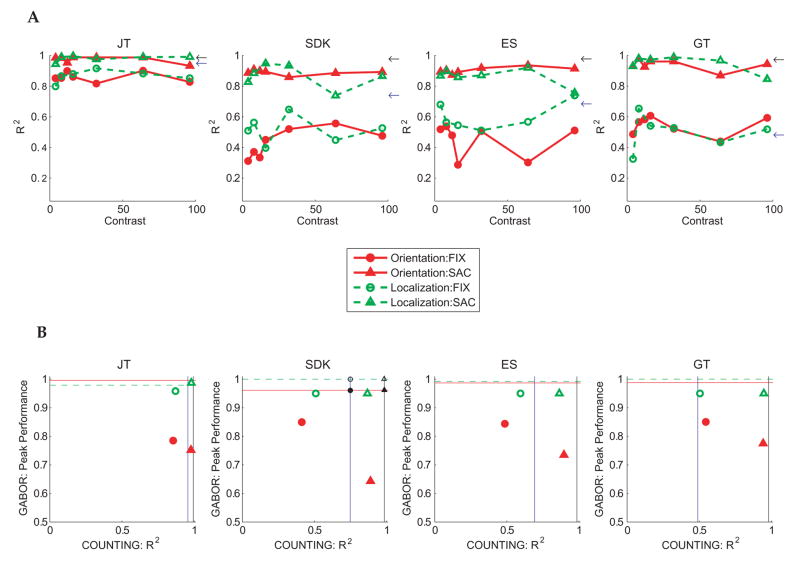
Figure 6.
Performance in the counting task. Data are shown separately for the 4 subjects tested (A): Correlations (R2) between the number of dots displayed and the report of dot number as a function of the contrast of the Gabor probe. Performance is shown separately for the two types of oculomotor instructions (saccades or steady fixation) and when counting was paired with either type of Gabor report (orientation or location). The arrows along the righthand ordinate show performance during trials when counting alone during steady fixation (blue) or with saccades (black) without any concurrent reports about the Gabor.
(B): Same results in the form of Attentional Operating Characteristics (AOC’s), with counting performance (R2) on the abscissa and peak Gabor performance (percent correct at 100% contrast) on the ordinate. Horizontal lines represent baseline Gabor performance (identification, solid; localization, dashed) when the Gabor tasks were done alone during steady fixation. Vertical lines represent counting performance when the task was done alone either during steady fixation (blue) or with saccades (black). The intersections of the pairs of vertical and horizontal lines are the independence points, showing expected performance when the tasks are done concurrently if there were no mutual interference. To make clear which task pairs corresponded to each of the 4 independence points, small black symbols are superimposed on the independence points in subject SDK’s AOC. The task pairs denoted by the 4 symbols are as follows: filled circle: counting during steady fixation, Gabor orientation judgments; open circle: counting during steady fixation, Gabor location judgments; filled triangle: counting with saccades, Gabor orientation judgments; open triangle: counting with saccades, Gabor location judgments.

