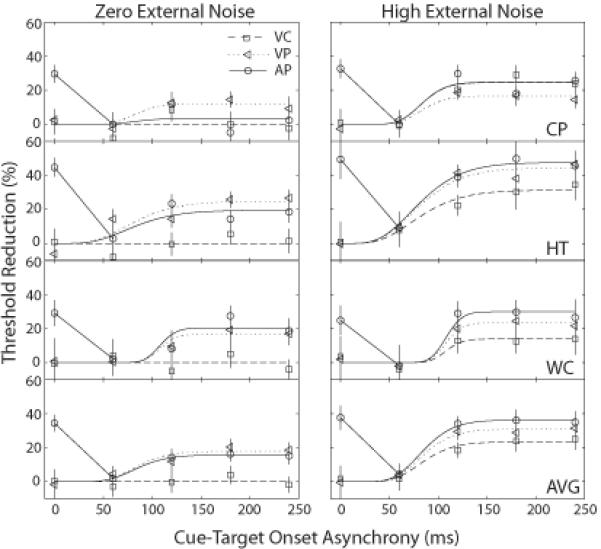
Figure 4.

Percent precuing advantages versus cue-target onset asynchrony (CTOA) for the three types of cues and the two levels of external noise. The smooth curves represent the predictions of the best fitting models. The estimated % threshold reductions in the AP condition were based on theoretical baselines that are very similar to the threshold in the CTOA=60 ms condition.
