FIGURE 4.
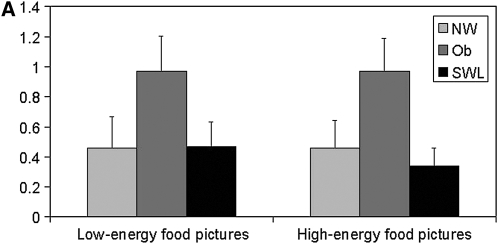
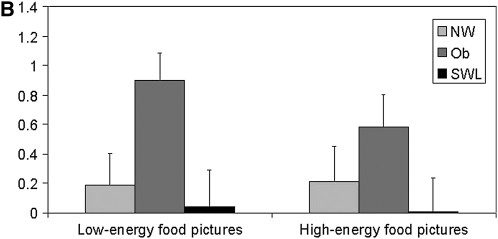
Mean (±SEM) changes in the blood oxygen level–dependent signal during blocks of low-energy and high-energy food picture cues relative to blocks of neutral pictures in the significant clusters of activation in the right precentral region [A: n = 18 normal-weight (NW) subjects, 16 obese (Ob) subjects, and 17 successful weight-loss maintainers (SWL); repeated-measures ANOVA: group P = 0.05; Bonferroni-adjusted post hoc comparison: P = 0.07 between Ob and SWL, P = 0.16 between Ob and NW, and P = 1.0 between NW and SWL; no significant group × task interaction] and in the left precentral region (B: n = 18 NW, 16 Ob, and 17 SWL; repeated-measures ANOVA: group P = 0.04; Bonferroni-adjusted post hoc comparison: P = 0.04 between Ob and SWL, P = 0.25 between Ob and NW, and P = 1.0 between NW and SWL; no significant group × task interaction).


