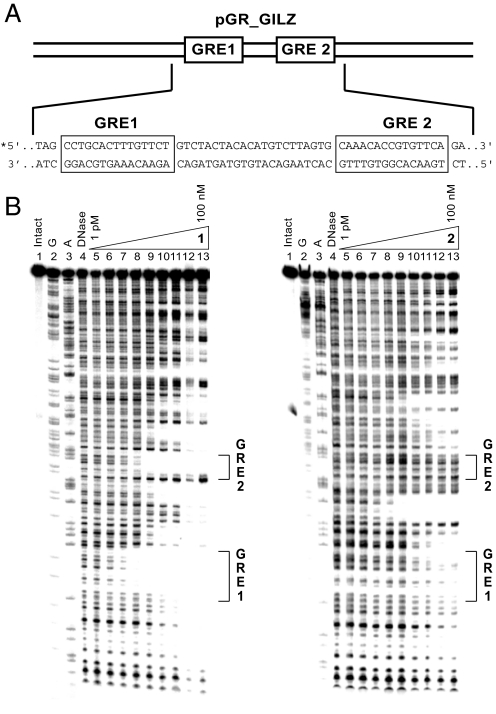
Fig. 3.
DNAse I footprinting of GILZ promoter region. (A) Sequence of the pGR_GILZ plasmid insert. (B) Storage phosphor autoradiograms from quantitative DNase I footprint titrations of polyamides 1 and 2. Lane 1, intact DNA; lane 2, G reaction; lane 3, A reaction; lane 4, DNase control; lanes 5–13, DNase I digestion products in the presence of 1, 3, 10, 30, 100, or 300 pM or 1, 3, 10, 30, or 100 nM polyamide, respectively.

