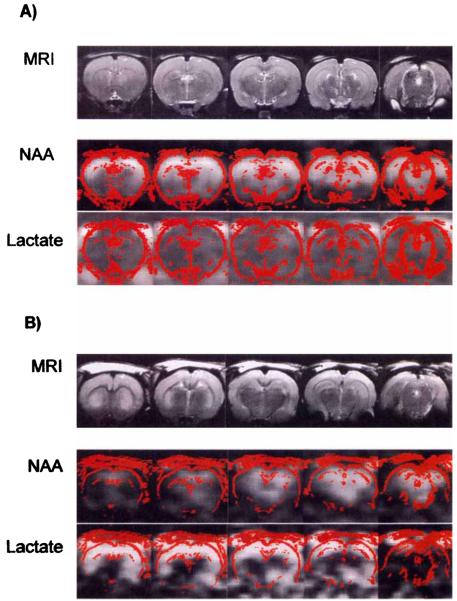
FIG. 1.
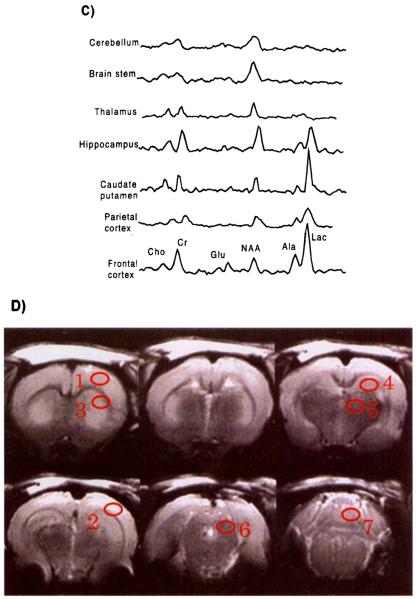
(A) Representative MRI and 1H-MRSI of control animal. T2-weighted MRIs are presented in the top row. The spatial distributions of signal intensity from the NAA and lactate/lipid spectral regions for image planes corresponding to the MRI planes are presented in the middle and bottom rows, respectively. The red outlines in the spectroscopic images represent a high-pass filter from the corresponding MRI, to provide spatial orientation. (B) Representative MRI and 1H-MRSI of the rat brain 24 h after global ischemia. T2-weighted MRIs are presented in the top row. The spatial distributions of signal intensity from the NAA and lactate/lipid spectral regions for image planes corresponding to the MRI planes are presented in the middle and bottom rows, respectively. The red outlines in the spectroscopic images represent a high-pass filter from the corresponding MRI. (C) Representative spectra from different brain regions obtained 24 h after global ischemia. Spectra were obtained from regions indicated on the MRI. Alanine and lactate are apparent in midfrontal and frontal brain regions but were not observed in caudal brain regions. (D) Coronal MRI sections illustrating regions from which representative spectra were obtained; 1 = anterior cortex, 2 = parietal cortex, 3 = caudate putamen, 4 = anterior hippocampus, 5 = thalamus, 6 = midbrain, 7 = cerebellum.


