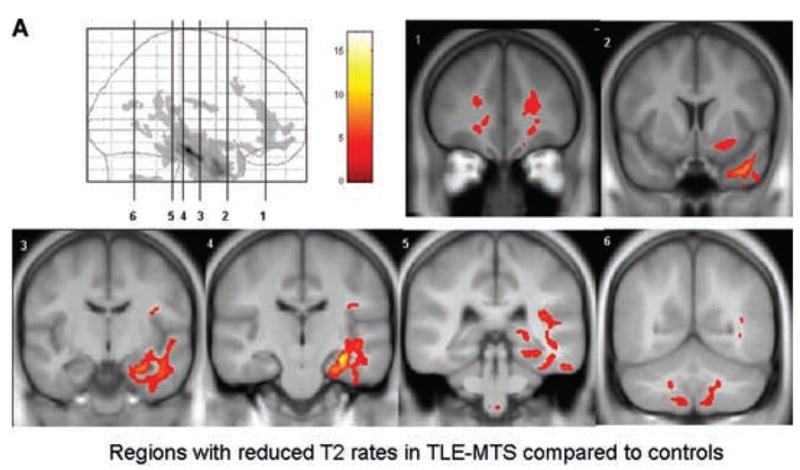
FIG. 3.


FIG. 3a. Regions with reduced-relaxation rates in TLE-MTS (a) and TLE-no (b) and in TLE-MTS compared with TLE-no (c). TLE-no had no regions with reduced-relaxation rate when compared with TLE-MTS, indicating that T2 relaxation abnormalities are more severe in the former group. The regions are displayed on the averaged symmetrical T1 image of the control group.
