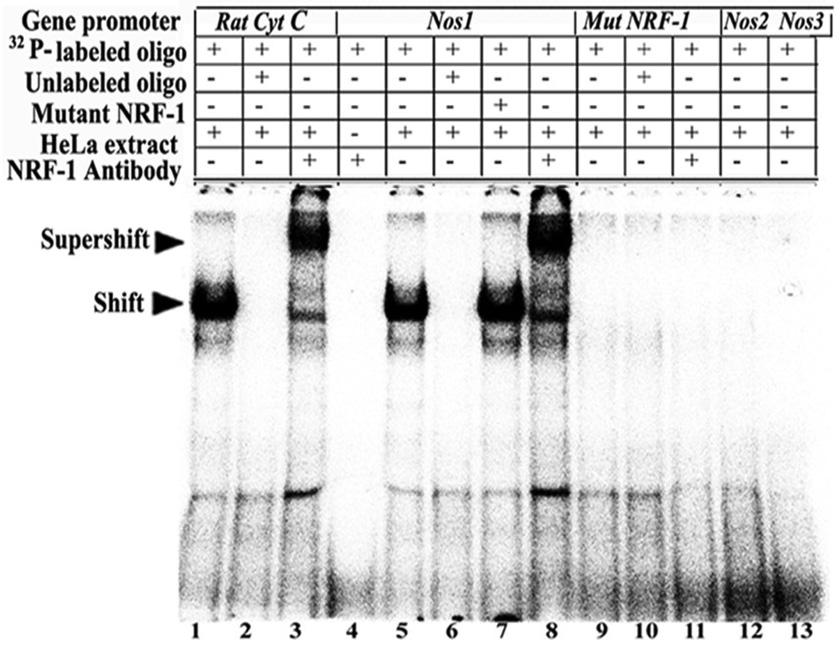
Fig. 1. NRF-1 interactions in-vitro and in-vivo with NOS isoform genes and promoter mutational analysis.
EMSAs for NRF-1. 32P- labeled oligonucleotides, excess unlabeled oligos as competitors, excess unlabeled mutant NRF-1 as competitors, HeLa extract, and NRF-1 antibodies are indicated by a + or a − sign. Arrowheads indicate NRF-1 shift and supershift complexes. The positive control, cytochrome c, shows a shift (A, lane 1) and a supershift (A, lane 3) band. When excess unlabeled competitor was added, it did not yield any band (A, lane 2). Nos1 subunit showed specific shift and supershift bands that were eliminated by excess unlabeled competitors (A, lanes 5, 8 & 6, respectively), while Nos2 and Nos3 showed no shift bands (A, lanes 12–13). Labeled mutated NRF-1 site on Nos1 was used as a negative control, and it did not yield any band (A, lanes 9–11). Excess unlabeled but mutated NRF-1 site could not compete (A, lane 7). Labeled oligos with NRF-1 antibodies alone with no HeLa extract did not yield any band (A, lane 4).

