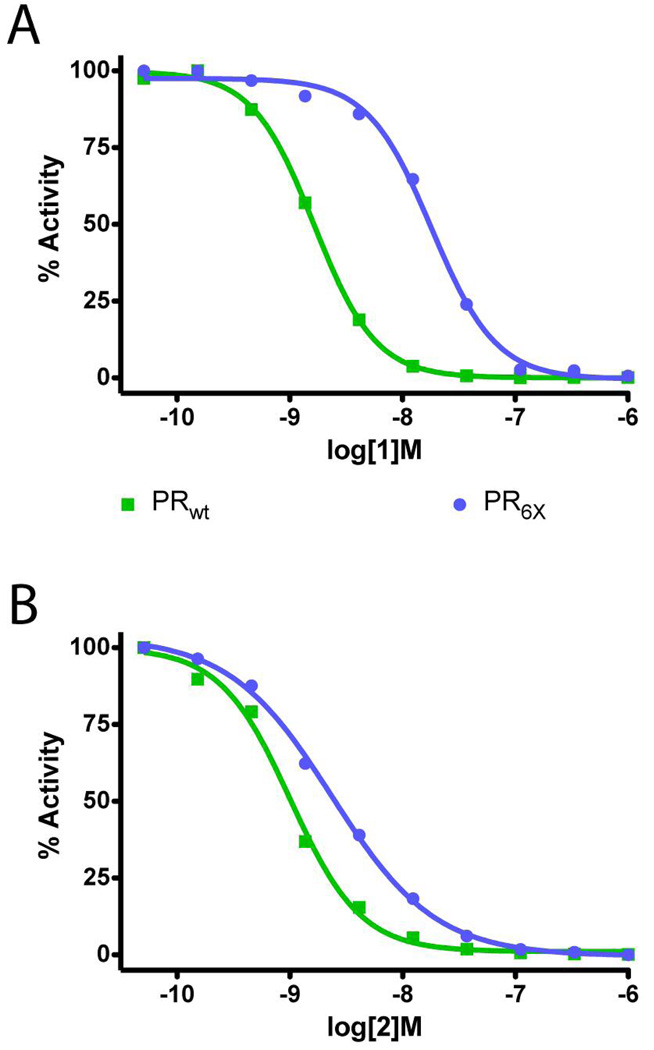
Figure 3.
IC50 curves for 1 (A) and 2 (B) based on in vitro assay of enzyme activity. IC50 determinations are shown for each protease inhibitor against PRwt (green squares) and PR6X (blue circles) proteases. Curve fitting analysis results in an IC50 of 6.0 nM for PRwt and 15.6 nM for the PR6X. Nonlinear regression analysis in Prism (Graphpad Software) was used for curve fitting of the substrate cleavage reaction.

