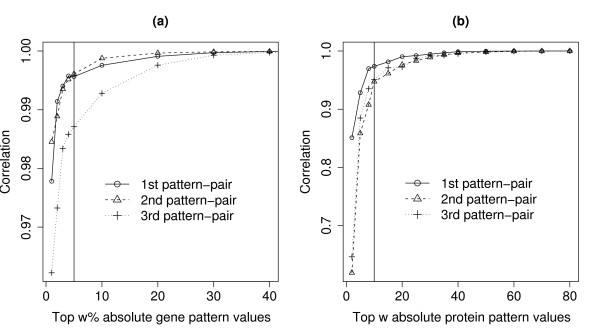
Figure 2.
Plots for determining the optimal value for w that classify genes and proteins into interesting or uninteresting sets. (a) Correlation between the gene scores from SVD based on all pattern values and scores based on the top w% absolute gene pattern values at various w values. The black vertical line corresponds to 5%. (b) Similar to (a) but for protein scores. The black vertical line corresponds to 10.

