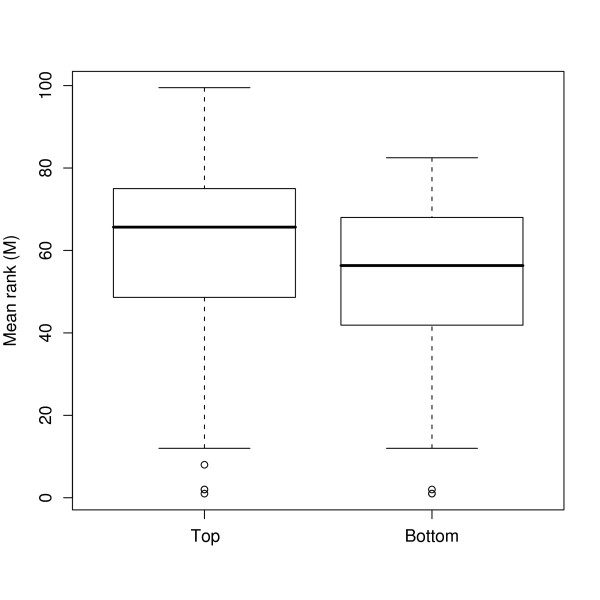
Figure 6.
Boxplot of the average rank of p-values from the GO analysis of the NCI data analysis using CFA. The boxplot of the average rank M of p-values, which are from the GO analysis on the biological process of genes, for protein GO terms that are from the top 10 and bottom 10 absolute protein patterns.

