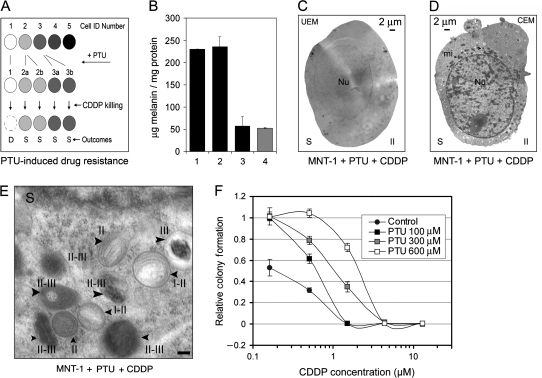
Figure 5.
Manipulation of melanosome status by 1-phenyl-2-thiourea (PTU) and cisplatin (CDDP) in MNT-1 cells. A) A hypothetical model of PTU-induced drug resistance in MNT-1 cells. Symbols, the same as in Figure 4, A, represent different stages of melanosomes (stage I–IV) in five individual MNT-1 cells, which illustrate melanosome stage transitions that occur in response to treatment with the drug. A clonal expansion of individual cells (eg, from cell numbers 2 and 3) enriched with stage II (ie, in cell 2a and 2b) and stage III (ie, in cell 3a and 3b) melanosomes would lead to increased cellular resistance to the drug. Cells at stage I (ie, cell number 1) or IV (eg, cell number 5) would be induced to have predominant stage II and III melanosomes by PTU, respectively. Cells that have predominant stage II and III melanosomes would be survivors (S) of CDDP treatment. B) Melanin content in untreated MNT-1 cells (column 1) and in MNT-1 cells treated for 72 hours with 100 μM (column 2) or 600 μM (column 3) PTU. KB-3-1 cells (column 4) were used as a nonmelanoma control. Columns represent the mean values of triplicate determinants and error bars correspond to 95% confidence intervals (CIs). C and D) Unstained electron microscopy (UEM) and conventional electron microscopy (CEM) images of MNT-1 cells simultaneously treated with PTU (600 μM) and CDDP (6.7 μM). E) Enlarged areas of an MNT-1 CEM micrograph, with arrowheads indicating stage II and stage II-III melanosomes induced by simultaneous treatment with PTU and CDDP. Scale bar = 0.2 μm. F) CDDP sensitivity in MNT-1 cells in the presence of PTU. Approximately 1000 MNT-1 cells were seeded in 60-mm cell culture dishes. Clonogenic assays were performed as described in Figure 3, B. Cytotoxicity curves were determined by counting surviving colonies (presented in Supplementary Figure 3, B, available online) with each point corresponding to the mean number of colonies and error bars indicating 95% CIs. One of two similar experiments is shown. mi = mitochondria; Nu = nucleus.

