Figure 6.
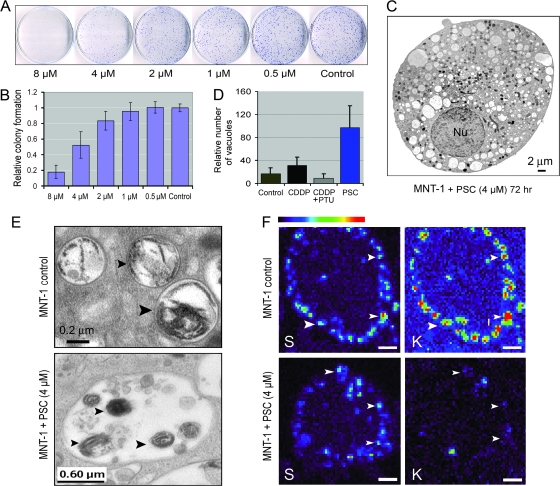
The effects of cyclosporin analog PSC-833 (PSC) on melanotic cell growth and EMC-related autophagy. A) Clonogenic assays of the effect of PSC on MNT-1 cell growth. The procedures were the same as described in Figure 3, B. Representatives of triplicate dishes of each treatment are shown. B) Quantitative analysis was based on clonogenic assays shown in (A). Columns represent mean colony number of three culture dishes; error bars correspond to 95% confidence intervals [CIs]. One of two similar experiments is shown. C) An electron microscopy (EM) image of a 4-μM PSC-treated cell after 72 hours. D) Autophagosome-like vacuolar structures in untreated MNT-1 cells and in MNT-1 cells treated with cisplatin (CDDP), CDDP and 1-phenyl-2-thiourea (PTU), and PSC. Columns represent mean vacuolar numbers from more than 13 EM images (or cells) of each treatment. Error bars correspond to 95% CIs. E) High-magnification image of untreated MNT-1 cells and PSC-treated MNT-1 cells. Arrowheads in the upper panel indicate two melanosomes with disorganized melanosomal matrices, whereas arrowheads in the lower panel point to a melanosome-containing autophagosome. F) X-ray mapping of potassium (K) in untreated MNT-1 cells or in cells treated with 4 μM PSC for 72 hours; Sulfur (S) was used as a melanosomal marker for MNT-1 cells because of its specific melanosomal accumulation, which has been previously described (8). Arrowheads point to melanosomes. Scale bars = 2 μm. Nu = nucleus.

