
Figure 1.
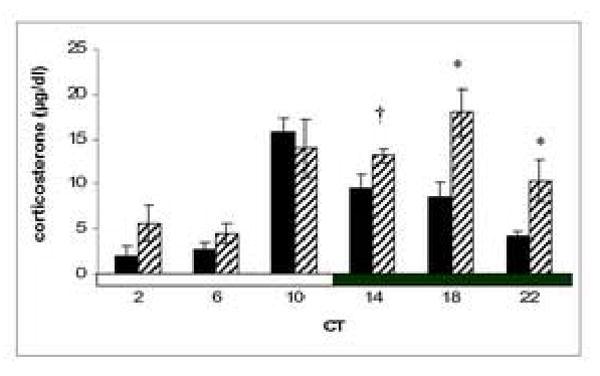
Mean ± SEM CORT for animals under the control (solid bars) or light-exposed (hatched bars) conditions in Exp. 1. The time of blood collection (in circadian time, where CT0 is subjective dawn) is represented on the x-axis. † denotes trend towards a difference from control (p = 0.052); * denotes significant difference from control (p < 0.05).