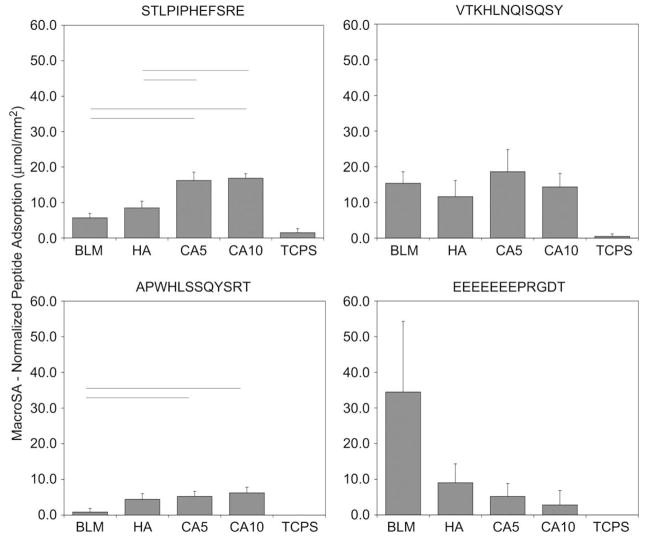
Fig. 8.
Peptide adsorption data normalized to sample dimensions (MacroSA) show that peptides A and S have increased adsorption on CA5 and CA10 when compared with BLM (for A, CA5 p = 0.006, CA10 p = 0.001; for S, CA5 p = 0.001, CA10 p < 0.001). Differences for peptide S were also evident between HA and the carbonated disks (CA5 p = 0.004, CA10 p = 0.001). All apatite groups were significantly different, p < 0.050, in comparison to TCPS for all four peptides investigated. Horizontal lines represent statistical significance.

