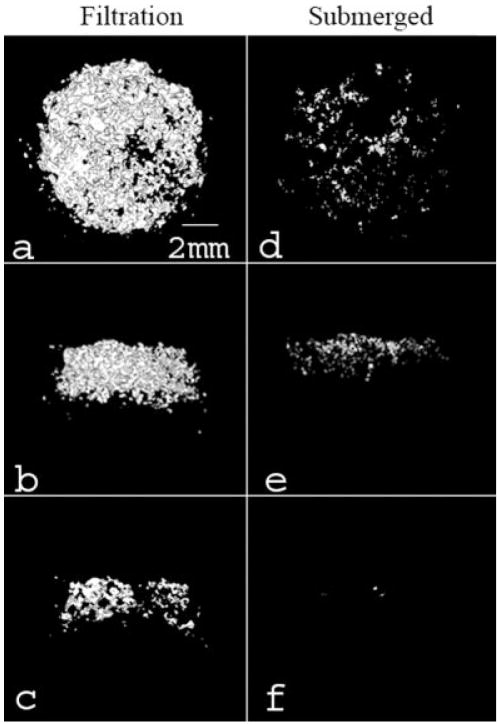
Figure 2.
Representative MicroCT images of the filtration group (a–c) and the submerged control group (d–f). These images represent top (a,d), side (b,e), and center cross-sections (c,f). A greater amount of mineral formed on the filtration scaffolds in comparison to the submerged control group. Renderings of the floating control group are not shown because mineral present in the images was minimal (<0.2 MV%). All images were created in MicroView® using the Isosurface tool (voxel size = 16 μm, threshold = 1000, surface quality factor = 0.55).

