
Figure 3.
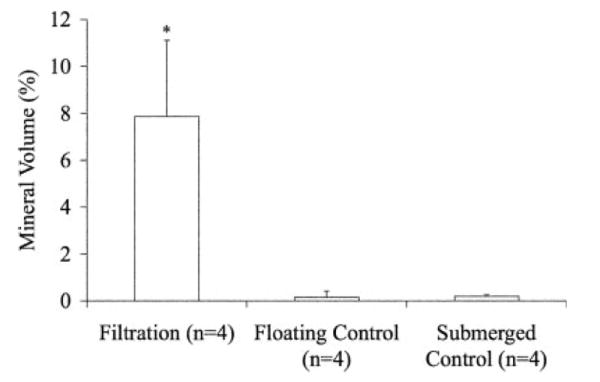
MV% for the filtration, floating control, and submerged control groups demonstrated the filtration group mineralized the greatest amount. (*p = 0.029 vs. both controls). MV% was calculated from MicroCT data using MicroView® at a threshold of 1000.