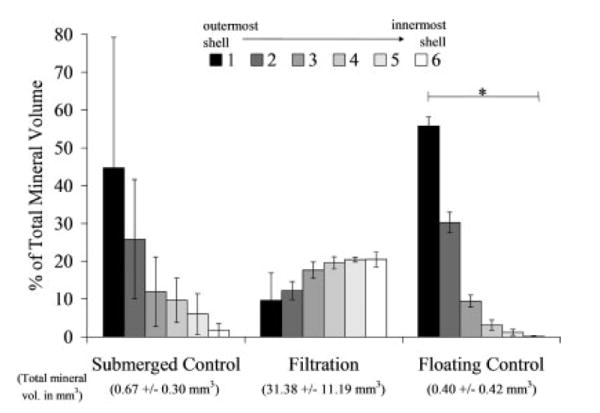
Figure 4.

Volumetric mineral analysis of the MicroCT images (threshold = 1000) showing the filtration scaffolds have a uniform mineral profile throughout all six regions of the scaffolds analyzed. The MV% for 6 concentric shell volumes show the control mineralized scaffolds have at minimum 60% of the mineral present in the 2 outer shells (shells 1 and 2). The floating control group shell volumes were statistically different from one another (n = 4, p = 0.002), whereas the submerged control and filtration groups did not show significance (n = 3, p = 0.051 and n = 4, p = 0.104, respectively). *Statistical significance found, p < 0.050.
