
Figure 5.
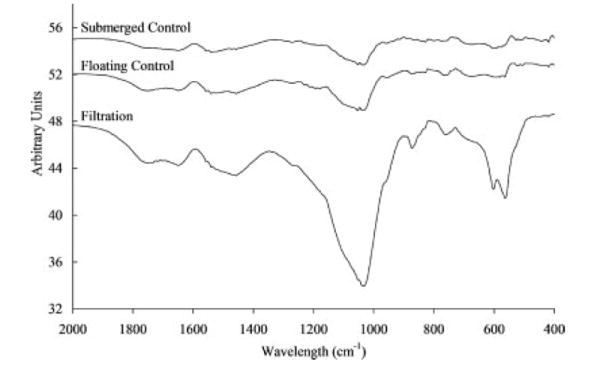
FTIR spectra for filtration, floating control, and submerged control groups showing the mineral deposited on the scaffolds was characteristic of hydroxyapatite with carbonate peaks (ν3c P–O 1032 cm−1, ν1 P–O 962 cm −1 ν4a O–P–O 602 cm−1, and ν4c O–P–O 561 cm−1 [filtration group only]) and carbonated apatite ( 1465 cm−1 [filtration and floating control groups]). Stronger peaks for the filtration group indicate the presence of more mineral.