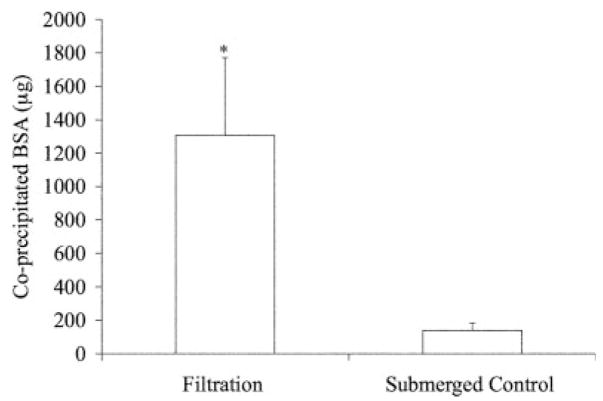
Figure 7.
Quantitative coprecipitated BSA values (μg) showing greater protein incorporation in the filtered scaffolds. The amount of BSA incorporated was quantified using UV Spectrophotometry at 494nm wavelength to detect the FITC–BSA. (*Statistically significant compared to submerged control group, p < 0.001).

