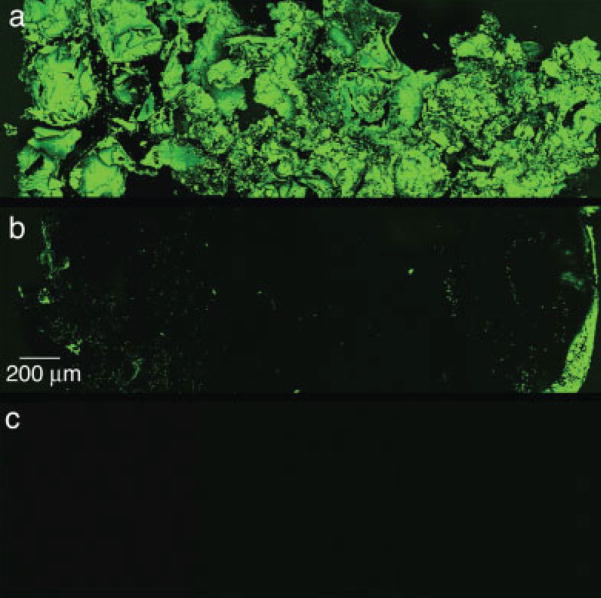
Figure 8.
Representative confocal microscopy images of transverse sections of filtration (a) and submerged control (b) groups coprecipitated with BSA for 3 days. The mosaic images were compiled from multiple images of the center cross-section for each scaffold in each group (n = 4 per group). The incorporation of BSA is shown by the fluorescence of FITC conjugated to the BSA. The filtration scaffolds showed uniform BSA coprecipitation throughout. A typical mineral shell, evidenced by more FITC seen on the left and right edges, is seen for the submerged control group. The presence of a mineral shell also supports less BSA incorporation. Autofluorescence of the mineral was not detected, shown by a representative image of a center cross-section of a scaffold mineralized via filtration for 5 days using the 4× SBF/2× SBF regimen precipitated without protein (c). Original images were taken at 10×. [Color figure can be viewed in the online issue, which is available at www.interscience.wiley.com.]

