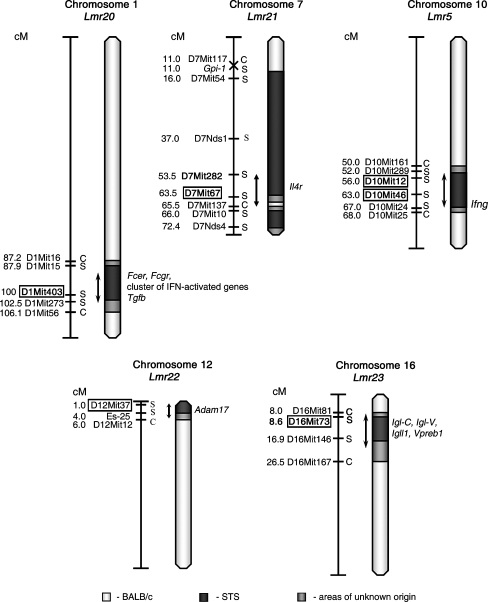
Fig. 3.
Position of the loci that control response to L. major in strain CcS-11. The regions of STS and BALB/c origin are represented as dark and white, respectively; the boundary regions of undetermined origin are shaded. Only the markers defining the boundaries the STS-derived segment and the markers that were tested for linkage are shown. The markers that exhibit significant P values (corrected for genome-wide search) are shown in boxes. The arrows indicate the regions of significant linkage

