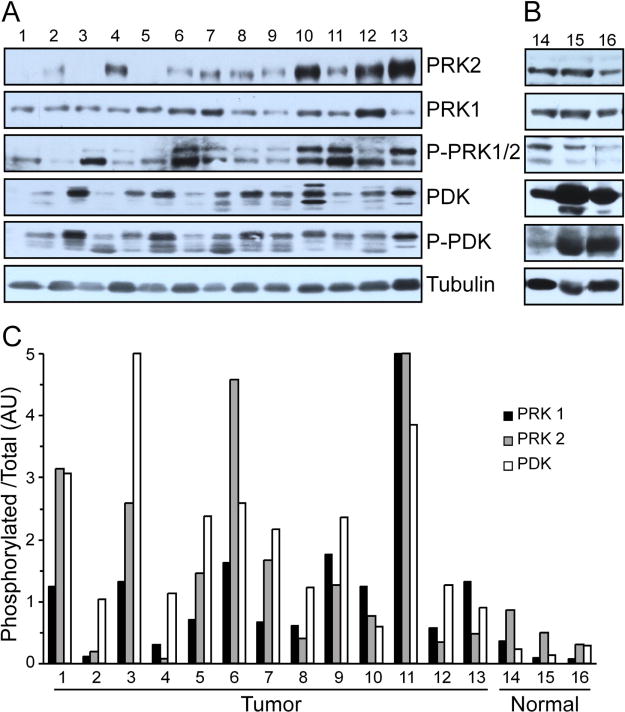
Fig. 4.
(A) Twelve samples of ovarian serous carcinoma (1–12) and the SKOV3 cell line (13) had statistically higher levels of PRK1 and PDK, but not PRK2, than the (B) three samples of normal ovarian surface epithelium (14–16). (C) The phosphorylation status normalized to total for the tumor samples and cell line was significantly greater than that for the normal ovarian surface epithelium for PRK1 and PDK, but not PRK2.

