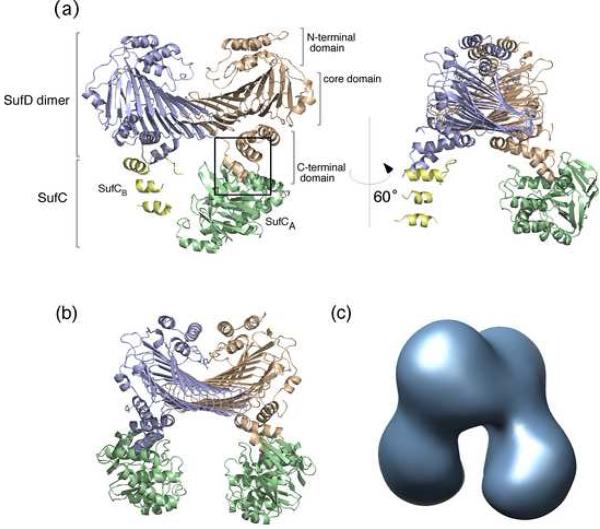
Fig. 1. Overall Structure of the SufC2-SufD2 Complex from E. coli.
(a) Ribbon representation of the crystal structure of the SufC2-SufD2 complex. The subunits are depicted by different colors. The view in the right panel is rotated by 60° about the vertical axis relative to the left panel. The interaction between SufC and SufD is indicated in the square box, and the close up view corresponding to this region is represented in Fig. 2 to provide details of the interaction. (b) The entire SufC2-SufD2 complex including the computer modeled SufCB subunit. Details of the model construction are shown in Fig. S1. (c) The 3D-reconstitution image of the SufC2-SufD2 complex obtained by electron microscopy.

