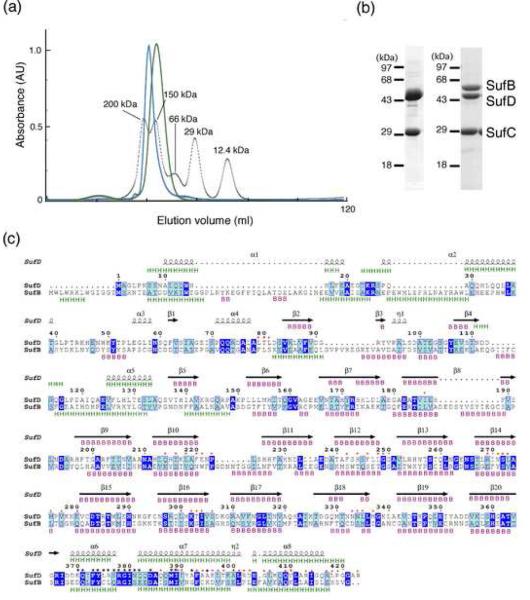
Fig. 5. Characterization of the SufBCD complex.
(a) Comparison of molecular size between the SufC2-SufD2 complex (green) and the SufBCD complex (blue). The elution profiles from the gel-filtration column (Sephacryl S-200) are shown with those of the size marker proteins including cytochrome c, carbonic anhydrase, albumin, alcohol dehydrogenase and β-amylase (dotted line) monitored by absorbance at 280 nm. (b) The SDS-PAGE of the SufC2-SufD2 complex (left) and the SufBCD complex (right). The gel was stained with Coomassie Blue. The SufC band in the left panel was slightly larger than that in the right panel because of the His10-tag sequence. (c) Sequence comparison between E. coli SufD and SufB. Identical and similar residues are highlighted in blue and cyan, respectively. The secondary structures of SufD in the crystal structure are shown above the sequence with spirals (α-helices) and arrows (β-strands). The secondary structures of SufD and SufB were predicted by JPRED server 43, and shown above and below the sequence alignment, respectively, with `H' for α-helices and `B' for β-strands. The SufD residues involved in binding with SufC are shown by black asterisks. Residues at the interface between the β-helical core domain and the C-terminal helical domain of SufD are marked with red asterisks.

