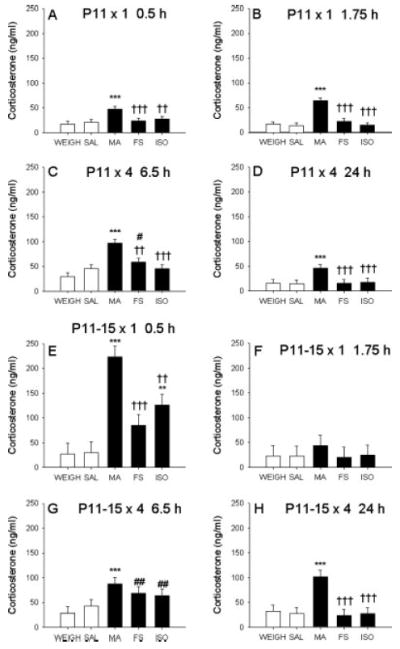
Fig. 2.

Corticosterone levels. CORT in plasma of animals treated with SAL, MA, ISO, FS, or WEIGH. (A) Increases in CORT occurred in MA-treated animals on P11 after one treatment at 0.5 h and at 1.75 h (B) on P11. All other treatments were comparable with basal levels after a single treatment. (C) At 6.5 h on P11, CORT levels were increased in MA- and FS-treated animals and at 24 h only in MA-treated animals (D). (E) When animals were treated four times daily from P11–14 and once on P15, MA-, FS-, and ISO-treated animals showed increased CORT at 0.5 h, with MA-treated animals having the highest levels. (F) At 1.75 h all groups were at baseline levels. (G) Levels of CORT were increased in MA-, FS-, and ISO-treated animals at 6.5 h on P15, but only the MA effect remained elevated at 24 h (H). *** = P < 0.001 compared with SAL and WEIGH, ** = P < 0.01 compared with SAL and WEIGH, ††† = P < 0.001 when compared with MA, †† = P < 0.01 when compared with MA, ## = P < 0.01 when compared with WEIGH, and # = P < 0.05 when compared with WEIGH.
