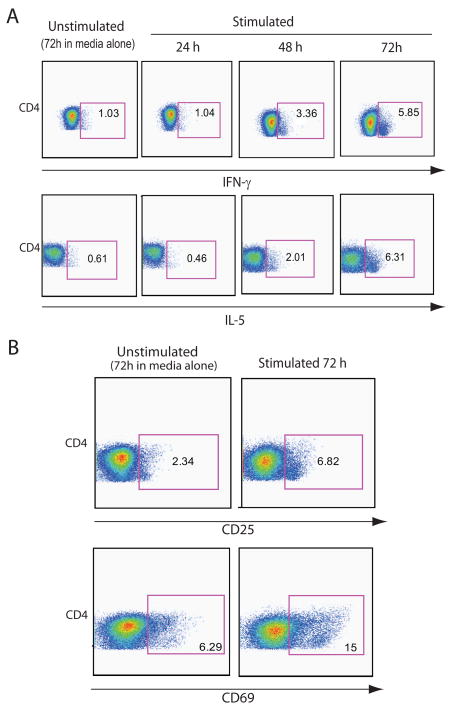
Figure 2.
Kinetics of CD4+T cell responses. (A) Ex vivo PBMC cytokine-secreting cell frequencies in a representative subject are shown one week after receiving the third vaccination. PBMC were thawed, stimulated with medium alone or AMA1 (10 μg/ml) for 24, 48 and 72 h; unstimulated control cells cultured for 72h are shown for comparison. Plots for CD4 T cells producing intracellular IFN-γ or IL-5 are shown at various times after in vitro stimulation. (B) Highest expression of the activation markers CD25 (IL-2R) and CD69 in CD4 T cells was detected after 72 h of stimulation with AMA1.

