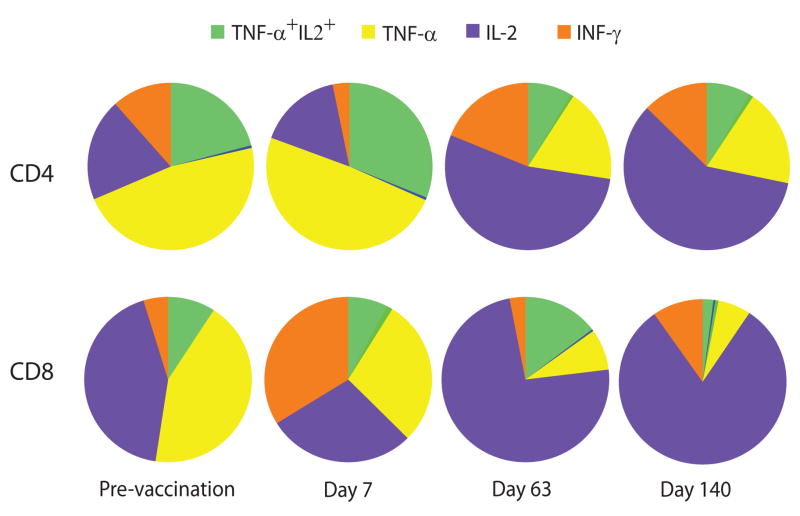
Figure 4.
Multifunctional T cell population patterns after vaccination. Proportion of CD4 and CD8 T cells producing IFN-γ, IL-2, TNF-α, and their combinations were assessed after stimulation with AMA1 antigen in PBMC (n=10) isolated on days 0, 63 and 140. Pie charts summarize the relative proportion of the three cytokines in CD4 and CD8 T cells. Data are corrected for corresponding background frequencies of unstimulated cells.

