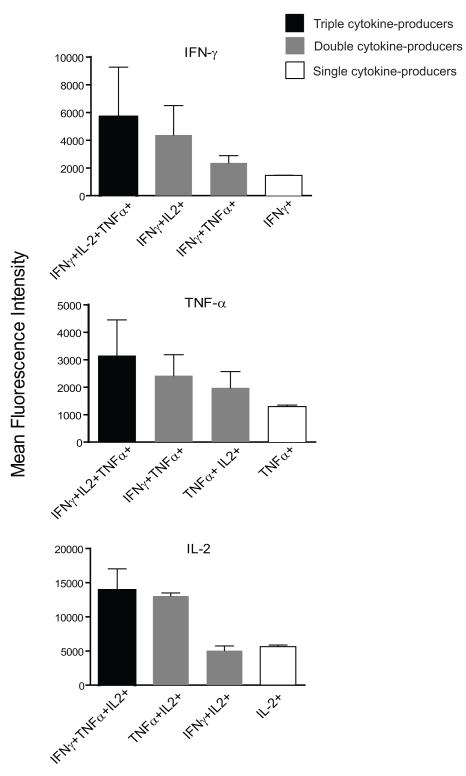
Figure 5.
Median fluorescence intensity (MFI) of cytokines in CD4 T cells. Bars indicate the median and standard errors of fluorescence intensity values in different populations of IFN-γ-, IL-2-, and TNF-α-producing cells (n=8). Shown are the values obtained on samples collected one week after the third vaccination (Day 63), following in vitro re-stimulation with AMA1. Triple cytokine producers are shown in black bars, double cytokine producers in gray and single cytokine producers in open bars.

