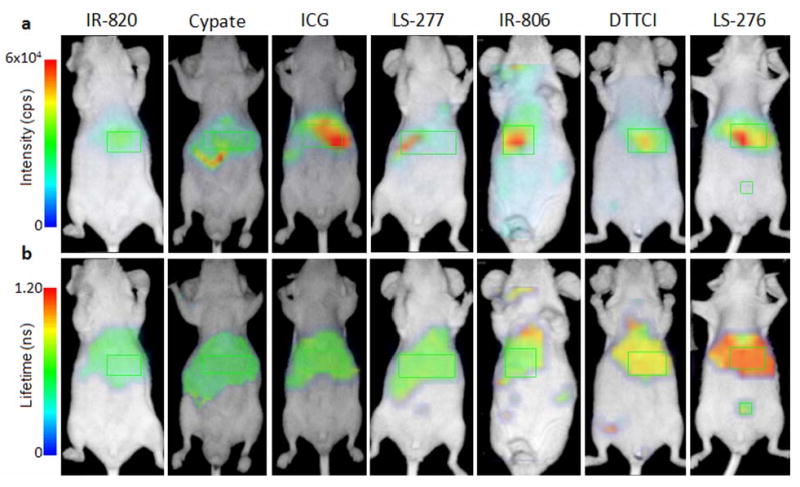
Fig. 2.

In vivo fluorescence intensity (a) and FLT (b) ventral aspect image maps of mice injected with NIR fluorescent dyes 1-4 hours post-injection. FLT maps were created from TPSF data acquired using the time-domain diffuse optical imaging system. FLT measurements were selected from the liver region (green rectangles) based on high fluorescence intensity and anatomical location for comparison to minimize discrepancies in organ distribution as all dyes showed evidence of hepatobiliary elimination. Some of the dyes showed partial renal clearance with fluorescence signal from the bladder (indicated by abdominal ROI for LS-276). Collected signal was insufficient for accurate FLT measurement from the bladder for the above specimens. Differences in the positions of the liver and kidney regions in different animals are due to the shifting of these internal organs in animals.
