
Fig. 3.
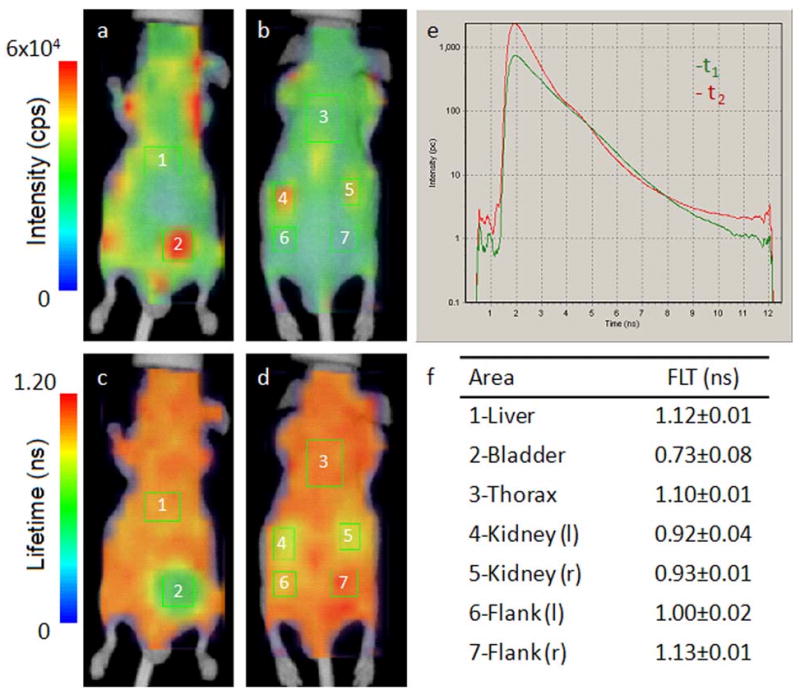
In vivo fluorescence intensity (ventral (a) and dorsal (b)) and FLT maps (ventral (c) and dorsal (d)) of nude mouse after 2 hours intravenous injection of LS-288 solution. The FLT distribution is heterogeneous with distinctly different FLTs observed in the bladder and kidneys relative the rest of the body. Representative fluorescence TPSFs for the liver (1) and bladder (2) regions of interest (ROIs) are shown in (e) and demonstrate the dominance of the long-FLT component in the liver and the short-FLT component in the bladder (multiexponential fitting data in Table 2.) The mean detected FLT from each ROI is presented in (f), which compares favorably with the expected water-rich environment in urine. ROI 6 corresponds to the dorsal aspect of ROI 2 (bladder), indicating that the short FLT relative to ROI 7 is due to muscle tissue overlying ROI 2 in this position. A tomographic method could be used to isolate the contribution of adjacent tissues to the FLT.