
Fig. 5.
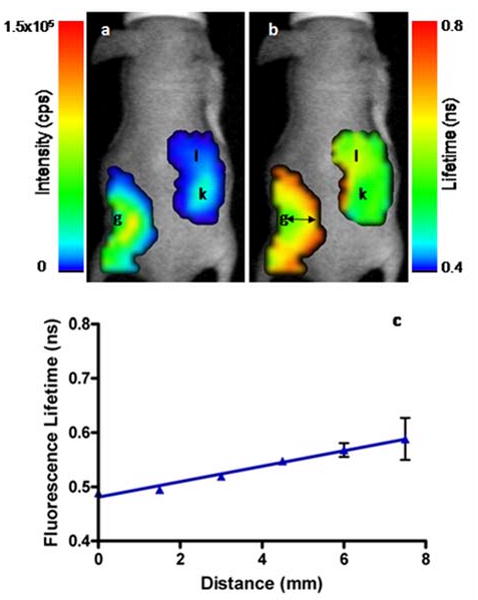
In vivo fluorescence intensity (a) and FLT (b) maps of a mouse 3 hours after subcutaneous implantation of cypate-loaded agarose gel (g). The FLT of cypate increased as it diffused through the subcutaneous space from the gel and was absorbed into the blood. Fluorescence can be seen in the right kidney (k) and the liver (l) regions with distinctly different FLTs consistent with the dye environment. A plot of FLT (b) at distances from the agarose gel (black arrows) demonstrates the difference in cypate FLT as it diffused from the gel.