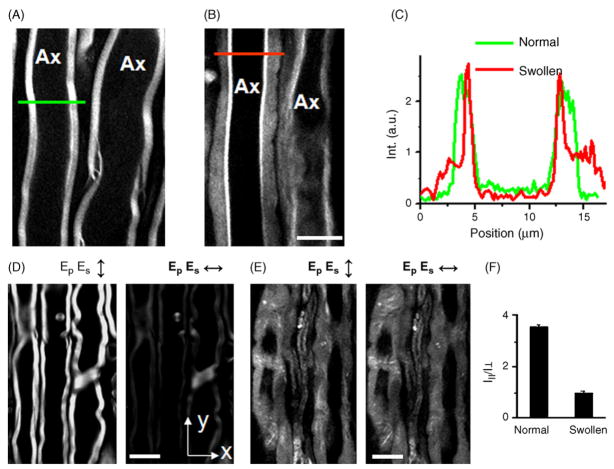
Fig. 3.
Characterization of lyso-PtdCho-induced myelin swelling by CARS microscopy. For all images, bar = 10 μm. (A) CARS image of normal myelin sheath wrapping two parallel axons. (B) CARS image of partially swollen myelin sheath acquired at 5 min after injecting 2 μL of 10 mg/mL lyso-PtdCho into the tissue. (C) CARS intensity profiles of normal and swollen myelin fibers. Green: taken along the green line in (A). Red: taken along the red line in (B). The intensity profiles clearly showed that the CARS intensity from the swollen region was approximately 1/3 of that from the compact region, indicating a reduction of the lipid packing density in the membrane. (D and E) CARS images of normal myelin sheath and totally swollen myelin sheath with vertical (↕) and horizontal (↔) excitation polarization. (F) The ordering degree characterized by I||/I⊥ of intra- myelin lipids for normal and swollen myelin sheath. Here I|| and I⊥ are defined as the CARS intensities with the excitation polarization parallel with or perpendicular to the myelin length. The ratio of I|| to I⊥ measures the ordering degree of the myelin lipids. For healthy myelin along y-oriented axons (D), the average CARS intensity from the equatorial plane generated with y-polarized beams (I||) is 3.53 (±0.09) times that with x-polarized beams (I⊥). I|| is larger than I⊥ because the symmetry axis of the CH2 groups in the equatorial plane of the myelin is perpendicular to the x direction. For the swollen myelin (E), the value of I||/I⊥ was measured to be 0.98 ± 0.09. Such independence on the excitation polarization (I|| = I⊥) indicates a complete degradation of the lamellar structure in the swollen myelin sheath. (For interpretation of the references to color in this figure legend, the reader is referred to the web version of the article.)

