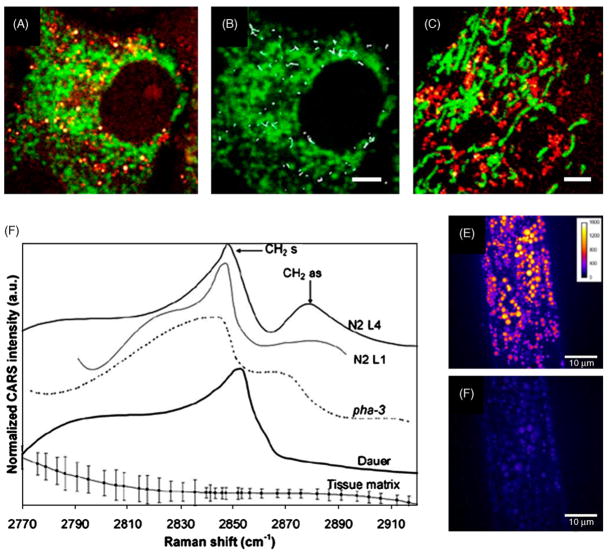
Fig. 4.
CARS images and spectra of intracellular lipid bodies. (A) Collocalized image of CARS (red) and TPEF (green) in a Y-1 Cell. CARS contrast comes from lipid droplets and TPEF contrast shows the mitochondria labeled by MitoTracker. (B) Trajectories of LDs over a period of 24 s. LDs underwent active transport movement of ~2 μm within 24 s. (C) Collocalized image of lipid droplets and mitochondria in 3T3-L1 cells shows very different distribution from Y-1 cells. Bars are 2 μm in (A)–(C) (from Ref. [23]. Used with permission). (D) CARS Spectra of wild-type and mutant C. elegans in vivo. (N2 L1 and L4: wild-type early and late stage larva; pha-3: feeding-deficient mutant nematode; Dauer: daf-4 mutant of promoted lipid store). Spectra at symmetric CH2 vibration (2845 cm−1) and asymmetric CH2 vibration (2880 cm −1) indicate lipid order shifted from gel to liquid when lipid storage is promoted. (E) Resonant at 2845 cm−1 and (F) nonresonant at 2790 cm−1 images of lipid storage in wild-type late-stage (N2 L4) larva in vivo. Bars are 10 μm in (E) and (F) (from Ref. [35]. Used with permission). (For interpretation of the references to color in this figure legend, the reader is referred to the web version of the article.)

