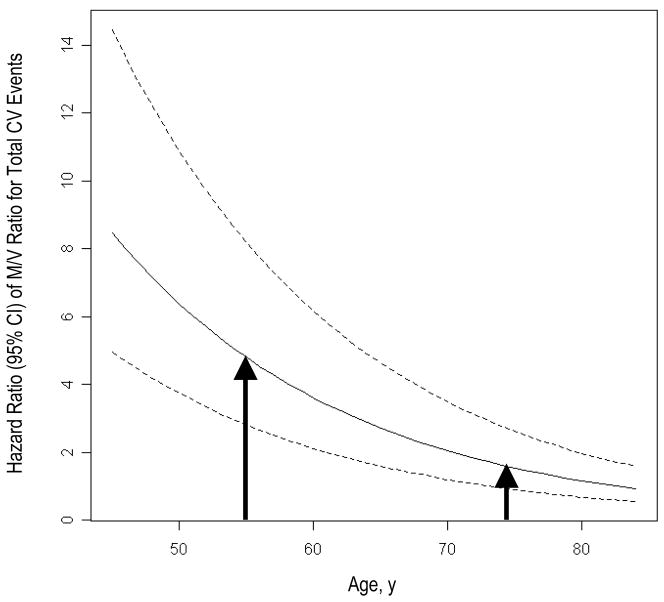
Figure 3.
Fitted curves represent hazard ratios (95% CI) of M/V ratio with respect to total CV events across increasing age while adjusting for age, sex, race/ethnicity, height, weight, hypertension status, LDL cholesterol, diabetes, and smoking. As shown, the risk is greater for those individuals who develop the “typical” age-associated LV remodeling phenotype at a younger compared to older age (arrows).

