
Figure 3.
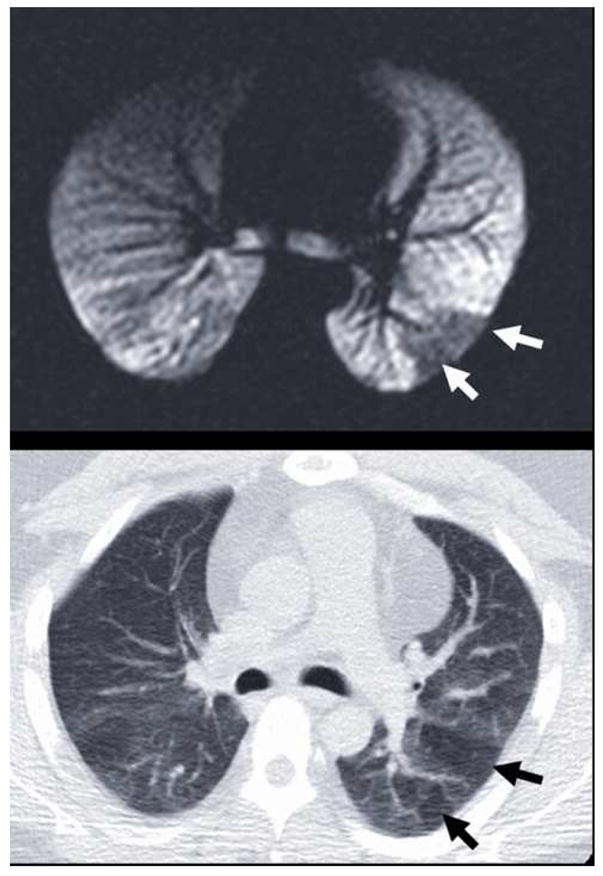
Typical example of the observed spatial correspondence (a) between ventilation defects on HP MRI (white arrows) and (b) hyperlucency on MDCT (black arrows). These defects in the left lower lobe reflect obstructive physiology at different lung volumes: 15% of TLC for HP MRI in (a) and FRC for expiratory MDCT in (b).