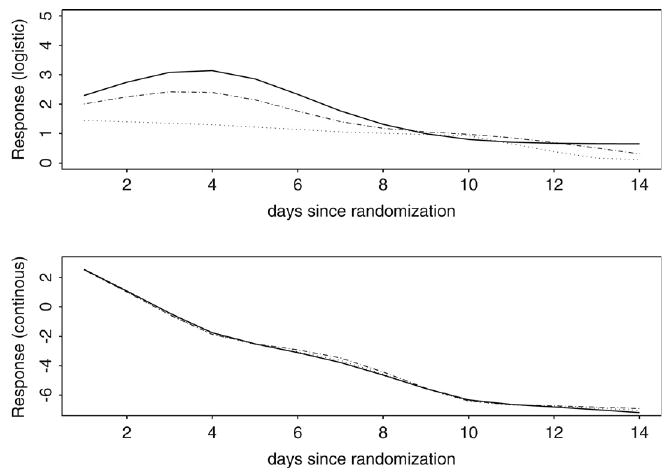
Fig. 2.

The top panel is a comparison of the logit transformed proportion of a positive volume over time across the three treatment arms of the acupuncture clinical trial. The lower panel compares the mean non-negative measurement over time across the treatment arms. “–” denotes the standard medical group; “.-.-” denotes the sham acupuncture group; “…” denotes the active acupuncture group.
