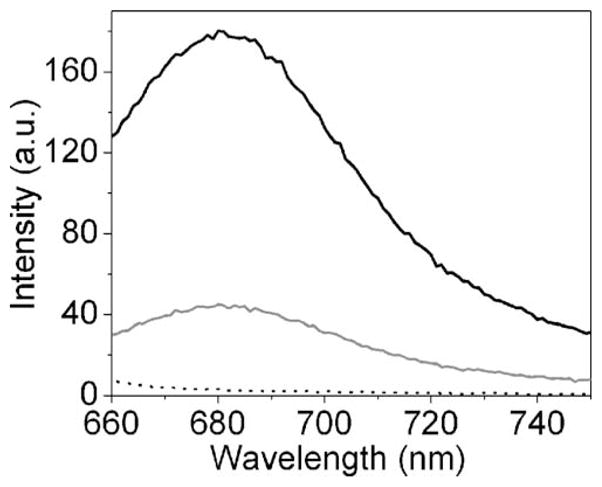
Figure 1.

Fluorescence emission spectra of Cy5 dispersed on glass (gray line) and SIF (black line). The dot line represents the emission background from SIF. Emission spectra were collected in front-face geometry on a SLM 8000 spectrofluorometer with 635 nm excitation from a xenon lamp.
