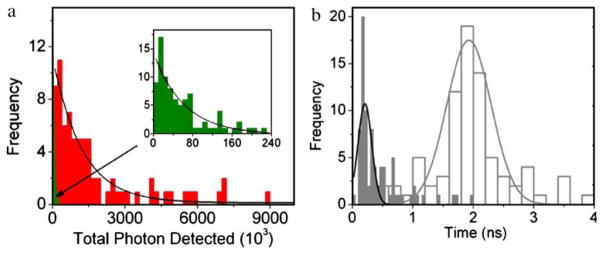
Figure 4.
a Histograms of total photons detected prior to photobleaching from Cy5 molecules on glass (green) and SIFs (red). b Histograms of lifetimes from Cy5 molecules on glass (white) and SIFs (gray). The fluorescence lifetime of single molecules was measured by time- correlated single photon counting with the TimeHarp 200 PCI-board (PicoQuant). Lifetimes were estimated by fitting to a χ2 value of less than 1.2 and with a residuals trace that was fully symmetrical about the zero axis.

