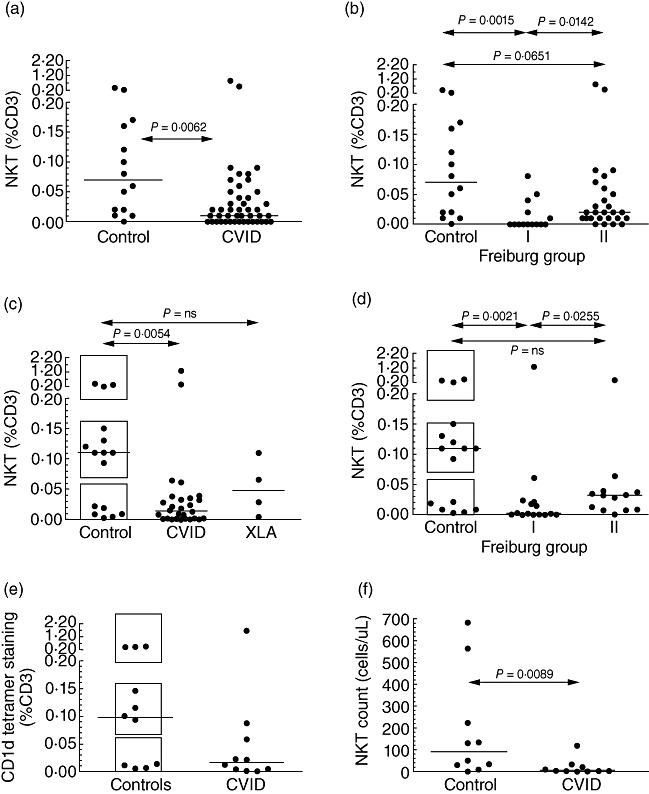
Fig. 2.

Invariant natural killer (iNK) T cell proportions expressed as a percentage of CD3+ cells in control subjects and common variable immunodeficiency (CVID) patients, based on staining of cryopreserved (a, b) cells from the first cohort, or fresh (c–e) peripheral blood mononuclear cells from the second. Graphs represent CVID patients versus control subjects (a, c) or the breakdown of CVID patients according to the proportion of isotype-switched memory B cells (b, d), with low proportions designated Freiburg group I and normal proportions, group II. In (c), analysis of four X-linked agammaglobulinaemia (XLA) patients is shown for comparison. In (c, d), boxes have been drawn to indicate the three apparent tiers of iNK T proportions in control subjects. (e) Proportions of iNK T cells as detected by CD1d tetramer staining in 10 CVID patients and 10 controls. (f) Absolute counts of iNK T cells in the peripheral blood of 10 CVID patients and 10 controls.
