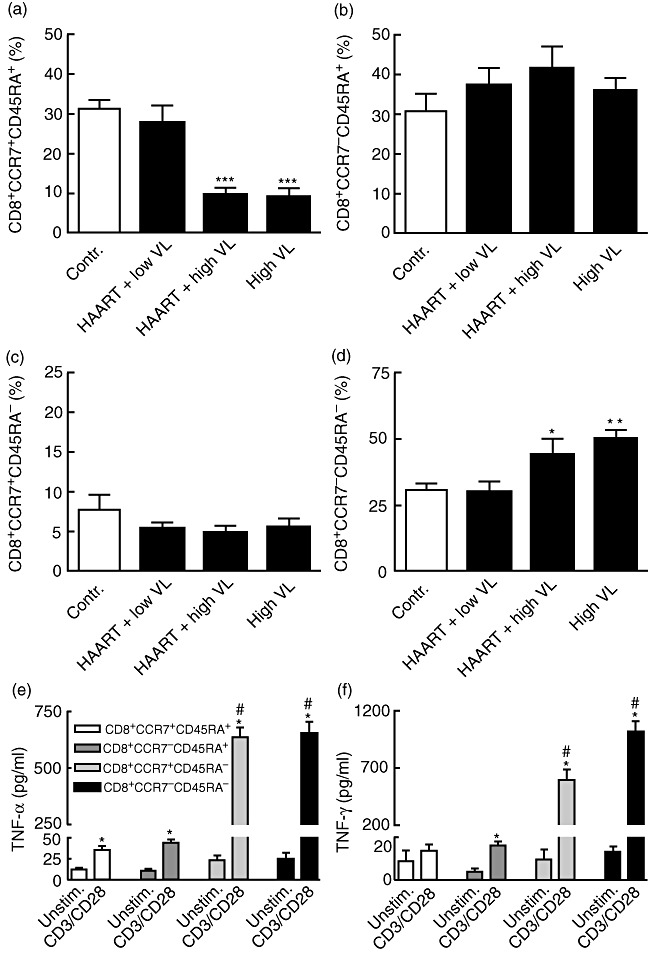
Fig. 3.

Expression of CCR7 in CD8+ T cells from human immunodeficiency virus (HIV)-infected patients. The proportion of different CD8+ T cell subpopulations according to the expression of CCR7 as assessed by flow cytometry in HIV-infected patients with high viral load (VL) before initiating highly active anti-retroviral therapy (HAART) (HIV RNA > 5000 copies/ml plasma, high VL, n = 9), HIV-infected patients with virological treatment failure (HIV RNA > 5000 copies/ml plasma, HAART + high VL, n = 8), HIV-infected patients on successful HAART (HIV RNA < 40 copies/ml plasma, HAART+ low VL n = 9), and healthy controls (contr. n = 9). *P < 0·05, **P < 0·01, and ***P < 0·001 versus controls and those on successful HAART. The lower panels show tumour necrosis factor (TNF)-α (e) and interferon (IFN)-γ (f) levels in different CD8+ T cell subpopulations after culturing for 24 h with or without anti-CD3/anti-CD28 activation (see Methods). The T cell subpopulations were obtained from four healthy controls, and the data are based in two parallel experiments from these individuals. *P < 0·05 versus unstimulated cells of the same CD8+ T cell subset. #P < 0·05 versus CD8+CCR7+CD45RA+ T cells. Data are mean ± standard error of the mean (panels a–f).
