Figure 3.
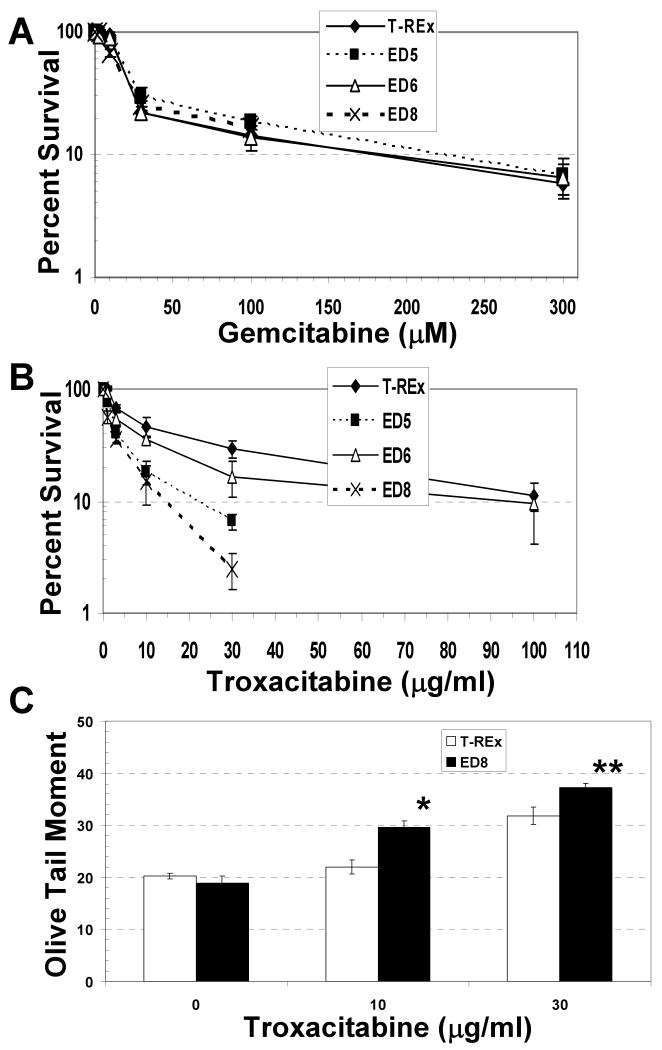
Effect of ED on cellular sensitivity to gemcitabine and troxacitabine. Colony formation efficiency and percent survival was determined as described in Figure 1 and Materials and Methods, following exposure to the indicated doses of gemcitabine (A) or troxacitabine (B). Shown is the average and standard deviation of at least 5 data points from 3 independent experimental runs. (C) DNA strand break levels in ED8 and T-REx cell lines following exposure to troxacitabine. After tet induction, ED8 and T-REx cells were treated with 0, 10 or 30 μg/ml troxacitabine for 24 hr and subsequently processed for Comet analysis (see Materials and Methods). Shown is the average and standard deviation of the OTM determined from a minimum of 50 cells from 3 independent experimental slides. *, P < 0.002; **, P < 0.01. Note: T-Rex cells without tet or troxacitabine treatment were found to have a similar OTM to tet-exposed T-Rex controls (data not shown).

