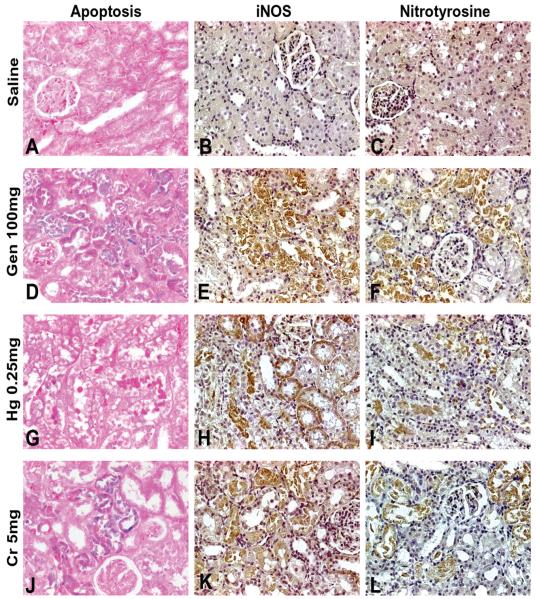
FIGURE 5.
Representative photomicrographs demonstrating immunostaining for apoptosis (A, D, G, J), expression of inducible nitric oxide synthase (iNOS) (B, E, H, K), and expression of nitrotyrosine (C, F, I, L). No immunostaining for apoptosis, iNOS, or nitrotyrosine was observed in saline-treated rats (A-C). Gen- (D-F) and Cr- (J-L) treated rats exhibited immunostaining for apoptosis, iNOS, and nitrotyrosine largely in the S1/S2 segments and to a lesser degree in the S3 segments, whereas Hg- (G-I) treated rats exhibited increased immunostaining for apoptosis, iNOS, and nitrotyrosine almost exclusively in the S3 segments. Apoptosis is indicated by blue color of nuclei. Original magnification of all figures: ×400.

